Appearance
Olive Embedded Web-based GUI
Debug Interface
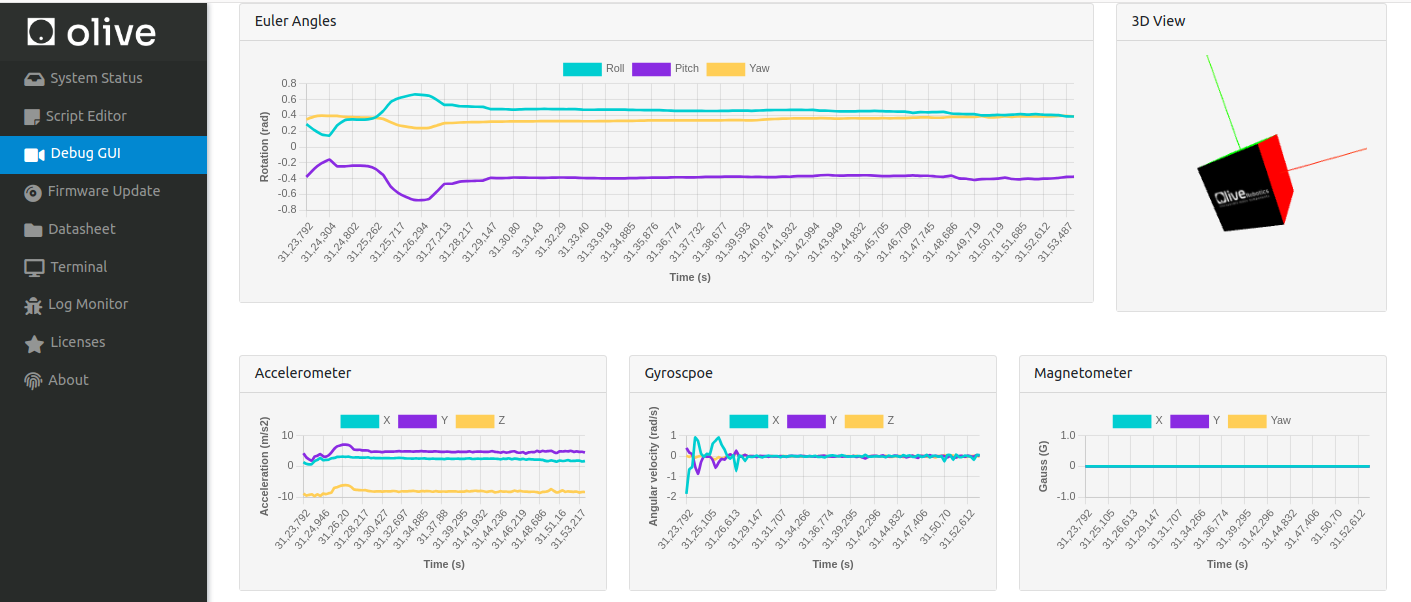
The debug interface is a tab that is part of the Olive GUI, It allows users to view real-time sensor data, which can help ensure that the sensors are functional and running properly. The real-time sensor data can be useful for troubleshooting and debugging any issues that may arise during the use of the device.
This tab can be particularly useful for developers who are creating new applications and want to check if the sensor is working correctly, or for users who want to verify that the sensor is providing accurate data. The tab allows to visualize the sensor data in numerical, graphic or other formats and compare it with other sensor's data or saved data, to make sure that sensor is working in the expected range.

In summary, the debug interface is an important feature of the Olive GUI that allows users to view real-time sensor data and ensure that the sensors are functional and providing accurate data. This tab allows users to verify sensor functionality and troubleshoot issues, making it an invaluable resource for anyone working with the Olive Robotics' modular robotic building blocks.